What Are the Top Renewable Energy Sources for 2026?

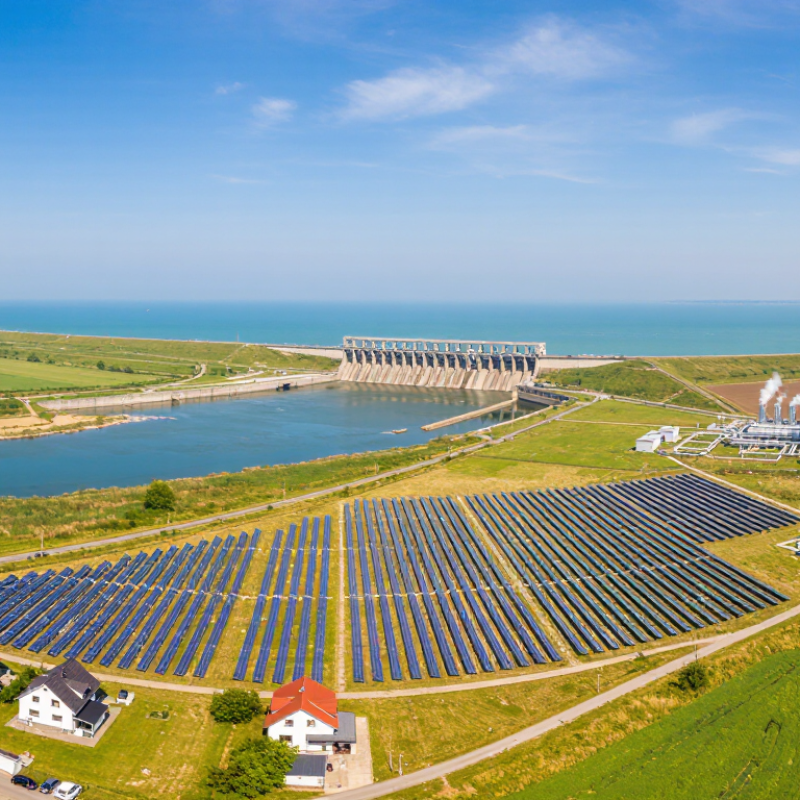
By 2026, renewable energy sources are shaping how homes, businesses, and power grids meet rising electricity demand. Solar panels now cover rooftops and open fields, while wind turbines turn steadily across coastlines and farmland. Hydropower remains an important source in many regions. Geothermal systems and sustainable bioenergy can also contribute where local conditions support them.

The strongest option depends on more than its headline output. Sunlight varies by season and location. Wind farms need suitable sites and new transmission lines. Hydropower can provide flexible electricity, but dams may affect rivers and nearby communities. Geothermal energy offers steady production, though drilling costs and geology matter. There is no universal winner.

That matters.

This guide compares leading renewable energy sources for 2026 by examining how they work, where they fit, and what limits their growth. It also considers practical questions: Can a technology supply power reliably? What storage or grid upgrades might it need? How do land use, materials, and operating costs shape its overall value? These details can be easy to overlook.

Energy forecasts change as projects, policies, and technology develop. A promising announcement does not guarantee a completed power plant, and performance in one region may not translate elsewhere. Readers should treat rankings as a starting point, not a final verdict. The clearest picture comes from comparing current evidence, local conditions, and the full energy system—not just a turbine’s size or a panel’s efficiency.
What Are the Top Renewable Energy Sources for 2026?

How Renewable Energy Sources Are Evaluated in 2026

What Are the Top Renewable Energy Sources for 2026?

How Renewable Energy Sources Are Evaluated in 2026

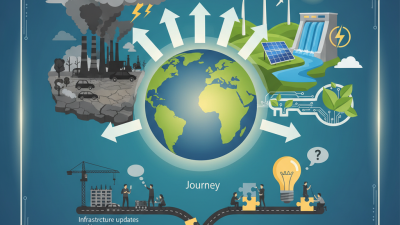
In 2026, renewable energy sources are assessed on more than how much electricity they generate. Analysts compare lifecycle emissions, project costs, construction time, and reliability across seasons. A solar farm may produce abundant power on clear afternoons, while output falls after sunset. Wind patterns vary by region, and hydropower depends on rainfall and water availability. These differences matter. No single metric tells the whole story.

Evaluations also consider how well a source fits the local grid. Storage, transmission access, land use, and effects on nearby communities can change a project’s real-world value. Geothermal power may offer steady output where suitable underground resources exist, but exploration can be costly and uncertain. Biomass assessments depend on feedstock sourcing and transport, not just the plant’s emissions. Data quality varies, too. Some comparisons still overlook delays, seasonal swings, or the limits of older grid infrastructure.
Solar Energy: Technologies, Growth, and Uses

What Are the Top Renewable Energy Sources for 2026?

Solar Energy: Technologies, Growth, and Uses

Solar power turns sunlight into electricity through photovoltaic panels, or into heat using solar-thermal systems. Panels on rooftops can serve homes and businesses, while utility-scale arrays feed electricity into regional grids. In 2024, solar added about 452 gigawatts of global capacity, according to IRENA’s Renewable Capacity Statistics 2025. That made it the largest contributor to new renewable capacity. The growth is striking, but sunlight is intermittent. Batteries, flexible demand, and stronger grids help match supply with evening use.

Technology is getting more adaptable. Bifacial panels capture light from both sides, while tracking systems tilt panels toward the sun. These designs can raise output, though performance depends on site conditions and installation costs. Solar thermal can also provide hot water or process heat, reducing fuel use in suitable buildings and industries. The International Energy Agency’s Renewables 2024 report identifies solar PV as a major driver of renewable expansion through 2030. Still, forecasts are not guarantees; permitting delays and grid constraints can slow projects.

Tips: Check a roof’s shade, orientation, and structural condition before estimating output. Compare expected annual production, not just panel capacity. Ask how storage changes costs and backup performance. Small details matter. Even a good system may disappoint if local grid limits are overlooked.

Wind Energy: Onshore and Offshore Development

Wind energy will remain a major renewable source in 2026, with onshore and offshore projects serving different needs. Onshore turbines can be built closer to existing roads and power lines. A technician may inspect a blade while morning fog still hangs over a ridge. These sites often cost less to develop, but nearby communities may raise concerns about noise, views, or wildlife. Those concerns deserve careful monitoring, not quick dismissal.

Offshore turbines can access stronger, steadier winds, especially far from shore. Their foundations, cables, and maintenance plans are more complex. Salt air wears on equipment, and rough seas can delay repairs for days. Still, larger turbines can generate substantial power from a compact area. Connecting that electricity to land remains a serious challenge. New transmission links need early planning, or clean power may wait offshore while demand continues inland.

The best projects begin with local conditions, not a standard blueprint. Wind measurements, seabird surveys, fishing activity, and grid capacity all shape a sound design. Developers also need to explain construction impacts in plain language. Good consultation takes time. It can still miss something. That is a useful reminder: forecasts are not guarantees, and long-term performance depends on maintenance, weather, and honest review.

What Are the Top Renewable Energy Sources for 2026? - Wind Energy: Onshore and Offshore Development

Measure Onshore Wind Offshore Wind Development Context for 2026
Global capacity added in 2024 Approximately 109 GW Approximately 8 GW Onshore accounted for most new wind capacity additions.
Global cumulative capacity at end of 2024 Part of approximately 1,136 GW of total wind capacity Part of approximately 1,136 GW of total wind capacity The global total includes both onshore and offshore installations.
Typical modern turbine rating Often around 3–6 MW per turbine; project designs vary by site. Commonly around 8–15 MW or more per turbine in newer projects. Larger offshore turbines can reduce the number of units needed, but require specialized installation and service.
Indicative capacity-factor range Approximately 25–40% Approximately 40–55% Actual results depend on wind conditions, turbine design, availability, and curtailment.
Typical setting Land-based sites, including plains, ridges, and agricultural areas. Coastal waters; fixed-bottom foundations are used in shallower sites, while floating systems can serve deeper waters. Site suitability depends on wind resources, seabed or ground conditions, grid access, and environmental review.
Key development advantages Established supply chains, comparatively accessible construction, and a wide range of potential sites. Generally stronger and more consistent winds, with projects located away from many land-use conflicts. Both technologies can contribute to electricity supply when supported by suitable transmission and grid planning.
Main development challenges Permitting, community acceptance, land access, transmission capacity, and variable output. Higher construction and maintenance complexity, marine conditions, port capacity, and subsea grid connections. Reliable project delivery depends on coordinated permitting, infrastructure investment, and supply-chain availability.

Note: Capacity additions and cumulative capacity are rounded global figures for 2024. Turbine ratings and capacity-factor ranges are indicative; individual projects vary by technology, location, and operating conditions. Capacity figures are based on the Global Wind Energy Council’s Global Wind Report 2025.

Hydropower, Geothermal, and Bioenergy in the Energy Mix

What Are the Top Renewable Energy Sources for 2026?

Hydropower, Geothermal, and Bioenergy in the Energy Mix

Hydropower

Hydropower remains a dependable source of renewable electricity where rivers and reservoirs can support it. Operators can adjust many turbines to meet changing demand, including evening peaks. Yet dams alter river habitats and can limit fish movement. Their benefits depend on careful planning, not just output.

Geothermal Energy

Geothermal energy draws on heat beneath the ground. In suitable locations, plants can provide steady power when sunlight fades and winds calm. A drilled well may bring hot water or steam to the surface, but exploration is costly and results vary. That uncertainty deserves more attention than it often gets.

Bioenergy

Bioenergy can turn agricultural residues, food scraps, and forestry by-products into heat, electricity, or fuel. Using local waste can reduce landfill pressure and support rural jobs. Still, burning biomass releases carbon dioxide, and not every feedstock is truly sustainable. Details matter.

A useful energy mix combines these sources with wind and solar, while weighing local water supplies, land use, and emissions. There is no perfect option. The practical choice may look different from one valley to the next.

Comparing the Leading Sources by Cost, Reliability, and Impact

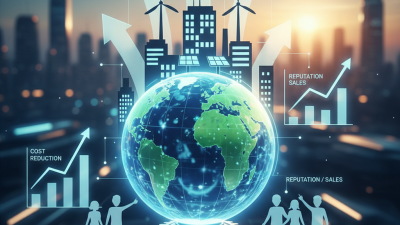
In 2026, solar and wind are often among the lowest-cost options for new electricity generation, though local conditions matter. A sunny rooftop can produce useful power for decades, while a windy ridge may support larger projects. Their weakness is timing: clouds and calm weather can reduce output when demand stays high. Batteries help shift electricity into evening hours, but add cost and require minerals, land, and careful recycling.

Hydropower can provide steady output and respond quickly to changing demand. Yet suitable river sites are limited, and drought can reduce generation. New dams may also disrupt fish, sediment, and nearby communities. Geothermal power offers dependable, low-carbon electricity where underground heat is accessible. Drilling is expensive and technically demanding, so its promise is not universal. A quiet strength. Biomass can use agricultural or forestry residues, but its climate impact depends on what is burned and how materials are replaced. Calling it automatically carbon-neutral would be too simple.

Cost comparisons should include grid connections, storage, maintenance, and the effects of weather—not just the price of building a plant. Reliability also means more than constant output: a mix of solar, wind, hydro, geothermal, and flexible storage can support the grid better than one source alone. Each choice leaves a footprint. Panels and turbines need materials; dams alter waterways; geothermal projects can disturb local ground. The best option varies by region, and forecasts for 2026 remain estimates, not guarantees.

What Are the Top Renewable Energy Sources for 2026?

Comparing indicative generation costs and typical capacity factors. Lower cost and higher capacity factor can be useful indicators, but actual results depend on location and project design.

How to read this: Levelized cost of electricity (LCOE) is shown in USD per megawatt-hour, while capacity factor is shown as a percentage on the right axis. Global weighted-average LCOE figures are indicative 2023 estimates; capacity factors are typical approximate ranges represented by midpoint values. Lifecycle greenhouse-gas emissions vary by technology and project: approximate literature ranges are 10–50 gCO₂e/kWh for solar PV, 7–20 for wind, 1–30 for hydropower, 6– geothermal (often around 10), and 10–100 for bioenergy. Capacity factor is not the same as dispatchability or system reliability.