How to Use Natural Forces to Generate Renewable Energy
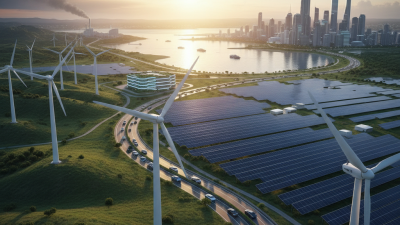
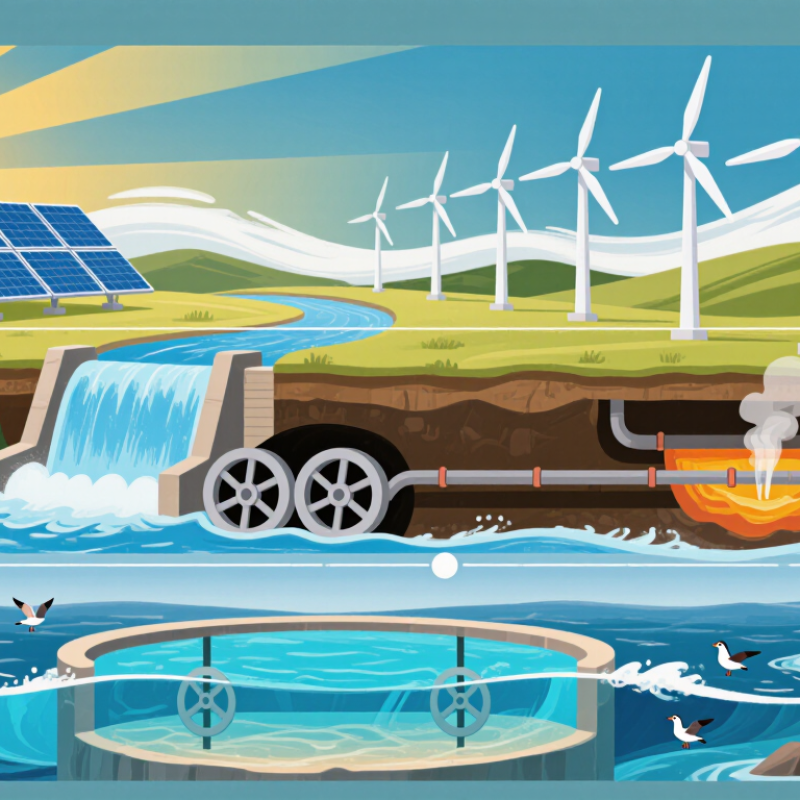
Every day, sunlight warms rooftops, wind crosses open ridges, and rivers carry water downhill. These natural forces can provide renewable energy when suitable technologies capture and convert them. Solar panels turn light into electricity, while wind turbines use moving air to drive generators. Hydropower systems draw energy from flowing or falling water. Geothermal plants use heat beneath Earth’s surface, and tidal systems harness the regular movement of the sea.
The right choice depends on local conditions. A sunny roof may suit solar panels, while a steady wind resource can support turbines. Water projects require careful attention to river flow, ecosystems, and nearby communities. Geothermal energy is promising in some regions, but drilling and site conditions can make it difficult elsewhere. Not everywhere. A technology that performs well in one place may be costly or unsuitable in another.
This guide explains how natural forces become usable energy and what to consider when comparing options. It covers the basic mechanisms, practical benefits, and trade-offs of each approach. Readers will also see why energy storage, grid connections, maintenance, and land or wildlife impacts matter. No system is effortless. Even clean power equipment requires materials, planning, and ongoing care. The details can be easy to overlook. Understanding both the potential and the limits helps households, communities, and decision-makers make more informed choices about renewable energy.
Assess Local Solar, Wind, Water, and Geothermal Resources
Assessing local energy starts with a map, not a purchase. Mark roof orientation, tree shadows, nearby ridges, streams, and utility access. Track sunlight across seasons; a bright winter afternoon may hide long summer shade. Use a simple site log for several weeks. Small differences matter.
For wind, note open exposure and obstacles, then compare readings at proposed hub height with long-term local records. A handheld reading near the ground can mislead. Look for steadier flow, not one dramatic gust. Water sites need year-round flow and usable head, the vertical drop available to a turbine. Seasonal trickles may look promising in spring, then nearly vanish by late summer. Sediment, fish habitat, and flood conditions also shape feasibility.
Geothermal potential depends on the goal. Ground-source heat pumps use stable shallow-ground temperatures for heating and cooling; electricity generation usually requires much hotter resources. Check local geology and drilling conditions with qualified specialists. It is tempting to rank resources by headline output, but maintenance, access, and seasonal variation often change the picture. Keep estimates conservative, record uncertainties, and revisit them after a full seasonal cycle. That’s less exciting, perhaps. The first set of notes will probably be messy.
Convert Sunlight: Solar PV Costs Fell 89% from 2010 to 2022 (IRENA)
Solar power’s price story is striking: IRENA reported that the global weighted-average cost of electricity from utility-scale solar PV fell 89% between 2010 and 2022. This measure estimates generation costs over a project’s lifetime; it is not the price every household pays for panels. It is a global benchmark, not a guarantee for every location.
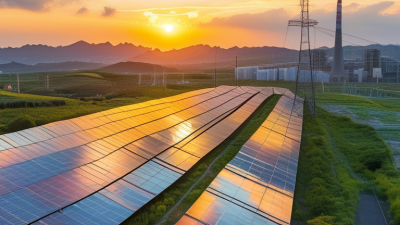
The change reflects cheaper equipment, improved project design, and more efficient installation. Picture a sunlit warehouse roof producing electricity during the afternoon, when nearby buildings need cooling. A well-positioned system can turn that daylight into useful power for decades. A steep drop.
Still, lower average costs do not erase local differences. Cloud cover, roof direction, grid access, financing, and storage can all affect a project’s value. The 89% figure also compares costs across years, rather than tracking one identical system from purchase to retirement. That distinction is easy to miss. Solar is far more affordable than it was, but careful site assessment remains essential.
How to Use Natural Forces to Generate Renewable Energy — Convert Sunlight: Solar PV Costs Fell 89% from 2010 to 2022 (IRENA)
| Measure |
Year or period |
Global figure |
What it shows |
| Utility-scale solar photovoltaic (PV) levelized cost of electricity (LCOE) |
2010 |
USD 0.445 per kWh |
Baseline global weighted-average cost of electricity from newly commissioned utility-scale solar PV projects. |
| Utility-scale solar PV LCOE |
2022 |
USD 0.049 per kWh |
The global weighted-average cost of electricity from newly commissioned utility-scale solar PV projects. |
| Change in utility-scale solar PV LCOE |
2010–2022 |
89% decrease |
Solar PV electricity costs fell substantially over the period, based on the change in global weighted-average LCOE. |
| Cost comparison with the cheapest fossil-fuel alternative |
New utility-scale projects commissioned in 2022 |
Solar PV was 29% lower |
IRENA reported that newly commissioned utility-scale solar PV had a lower LCOE than the cheapest fossil-fuel-fired option in 2022. |
| Solar PV share of renewable capacity additions |
2022 |
191 GW of 295 GW; approximately 65% |
Solar PV accounted for about two-thirds of global renewable power capacity added during the year. |
| Sources: International Renewable Energy Agency (IRENA), Renewable Power Generation Costs in 2022 and Renewable Capacity Statistics 2023. LCOE means levelized cost of electricity; GW means gigawatts. |
Generate with Wind: Onshore Wind Costs Fell 69% from 2010 to 2022 (IRENA)
Wind turbines convert moving air into electricity without burning fuel at the point of generation.
Onshore wind has also become much less expensive. IRENA reports that the global weighted-average cost of electricity from new onshore wind projects fell 69% between 2010 and 2022. That change reflects better turbine design, larger rotors, and more efficient installation. A rotor sweeping above a field can capture stronger winds than a smaller machine could. Still, the headline figure does not describe every project. Costs vary with wind conditions, financing, grid access, and local construction needs.
Tips: Check whether a site has steady wind, not just occasional gusts. Compare project costs with grid connection expenses. Ask how nearby residents and wildlife may be affected.
The cost decline makes wind a stronger option, but it does not make every location suitable. Turbines need careful siting, and their output changes with the weather. Storage, transmission lines, and other power sources can help balance those changes. A windy ridge far from existing power lines may prove less practical than it first appears. The progress is real; the trade-offs deserve equal attention.
Harness Water: Global Hydropower Capacity Reached 1,412 GW in 2023 (IHA)
Water turns elevation and flow into electricity, from a fast mountain stream to a managed reservoir. The International Hydropower Association’s 2024 World Hydropower Outlook reports 1,412 GW of global hydropower capacity in 2023. That is substantial. Capacity describes potential output, not the electricity produced every hour. Drought, seasonal river flows, and maintenance all affect actual generation.
Hydropower can provide flexible power when wind or solar output changes. Reservoir plants can store water for later release, while run-of-river projects rely more directly on current flows. Some facilities also pump water uphill when electricity is plentiful, then release it through turbines when demand rises.
The number is impressive, but it can hide uneven performance. A turbine hall may look clean, while altered river flows and sediment build-up still require careful management. Good planning means tracking both power output and local watershed conditions.
Tips: Check a project’s reported generation alongside its installed capacity. Look for seasonal flow data, maintenance plans, and monitoring of river health. A single headline figure rarely tells the whole story.
Tap Earth’s Heat: Global Geothermal Capacity Reached About 15 GW in 2023 (IRENA)
Earth’s heat is already feeding power grids. IRENA’s Renewable Capacity Statistics 2024 reports about 15 GW of installed geothermal electricity capacity worldwide at the end of 2023. That is a modest fleet beside solar and wind, yet geothermal plants can supply power when skies are dark and air is still. The figure measures capacity, not electricity actually generated. That distinction matters.
Wells bring hot fluids or steam to the surface to drive turbines; some plants return cooled water underground. Local geology shapes the economics. Drilling deep into fractured rock can uncover useful heat—or disappoint. There is risk. The IEA’s 2024 report The Future of Geothermal Energy estimates that next-generation geothermal could meet up to 15% of global electricity-demand growth through 2050, if techniques scale and costs fall. That is a scenario, not a forecast. Water use, induced seismicity, and well performance require careful monitoring. No universal template exists. The 15-GW baseline reflects proven infrastructure, but exploration remains costly and uncertain. Better information from each well may matter as much as drilling deeper.