How to Source Renewable Energy Globally in 2026?

Sourcing renewable energy globally in 2026 will require more than signing a low-cost power purchase agreement. Companies must examine where electricity is generated, when it reaches the grid, and whether new capacity is genuinely added. Francesco La Camera, Director-General of the International Renewable Energy Agency, has said, “Renewables are the key to a sustainable energy future.” That principle now faces practical tests in every market.

A credible sourcing strategy should combine solar, wind, hydropower, geothermal energy, and carefully assessed storage. It should also review grid reliability, transmission limits, certificate quality, and supplier performance. A wind project in Texas may offer different benefits from a solar project near Johannesburg. Local conditions matter. So does timing.

Start with the company’s electricity profile. Map facilities, hourly demand, emissions, and expansion plans. Then compare physical contracts, virtual PPAs, utility programs, and energy attribute certificates. Check additionality, geographic matching, retirement records, and double-counting controls. Independent assurance can strengthen confidence, especially across unfamiliar markets.

The data may be incomplete.

That is a weakness worth admitting. Forecasts can miss congestion, drought, curtailment, or delayed construction. A project described as “green” may not deliver meaningful regional impact. Buyers should therefore document assumptions and revisit them annually. They should ask suppliers for evidence, not attractive promises.

This guide explores how procurement teams can balance cost, credibility, resilience, and climate impact. It focuses on decisions that work beyond spreadsheets. Global sourcing is possible, but it is rarely simple. The strongest plans remain transparent, locally informed, and open to correction.

How to Source Renewable Energy Globally in 2026?

Define Renewable Energy Sourcing Goals, Scope, and Evaluation Criteria

How to Source Renewable Energy Globally in 2026?

A practical sourcing plan begins with a precise goal. Decide whether the target covers electricity, heating, transport, or all energy use. State the baseline year and set a measurable deadline. For example, a company may target 80% renewable electricity by 2030. It should also define whether this means annual consumption or hourly matching. Those choices produce very different results.

Scope must include every relevant facility, office, warehouse, and production site. Record locations, electricity demand, operating hours, and expected growth. A global plan should address local grid conditions and renewable availability. It should also clarify whether suppliers, leased buildings, and outsourced operations are included. The first draft is rarely complete. Missing one high-use facility can distort the entire target.

Evaluation criteria should balance climate impact, credibility, cost, and operational risk. Check project ownership, commissioning dates, generation technology, and certificate retirement records. Assess additionality where possible, rather than accepting every certificate equally. Compare annual matching with monthly or hourly matching. Request third-party assurance and retain invoices, contracts, meter data, and retirement evidence. A weighted scorecard can improve consistency, but rigid scoring may hide local realities.

A remote site may need a transitional solution. That is not failure. It requires transparent disclosure, a review date, and a clear path toward stronger sourcing.

Map Global Renewable Energy Markets, Resources, and Regulatory Conditions

How to Source Renewable Energy Globally in 2026?

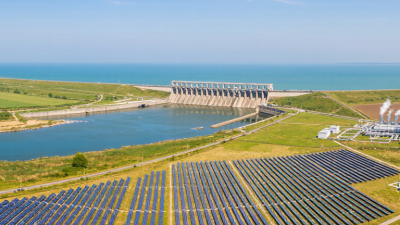
Global renewable energy sourcing begins with a market map, not a supplier list. Compare solar, wind, hydro, geothermal, and bioenergy resources by region, season, and grid access. Satellite data can show strong solar exposure, but local measurements reveal dust, storms, and land constraints. Small details matter.

Regulatory conditions require equal attention. Review auction rules, permitting timelines, grid-connection standards, tax treatment, and foreign ownership limits before selecting a project. Check whether renewable certificates are recognized in the target market. Confirm how authorities verify generation, emissions claims, labor practices, and environmental safeguards. Rules can change quickly. Keep written evidence.

Resource quality does not guarantee commercial reliability. A windy coastal zone may lack transmission capacity, while a sunny inland area may face water stress or community opposition. Map substations, roads, ports, curtailment risks, and extreme-weather exposure alongside resource data. Consult regulators, grid operators, local engineers, and affected communities. Their practical knowledge often corrects desktop assumptions.

A credible sourcing process should test three scenarios: conservative, expected, and disrupted. Model price volatility, delays, storage needs, and currency movements. Recheck every major assumption quarterly. Some forecasts will be wrong. That is normal, but ignoring uncertainty is not. Use independent technical reviews and transparent records to support decisions that remain defensible across markets.

Compare Procurement Models, Technologies, Contracts, and Cost Structures

How to Source Renewable Energy Globally in 2026?

Global renewable sourcing now requires more than choosing the lowest tariff. Buyers can use physical power purchase agreements, virtual PPAs, utility green tariffs, or unbundled certificates. Each model transfers different risks. Physical contracts offer clearer delivery, but grid access may be limited. Virtual contracts improve geographic flexibility, yet expose buyers to settlement and basis risk.

Physical contracts offer clearer delivery, but grid access may be limited.

Virtual contracts improve geographic flexibility, yet expose buyers to settlement and basis risk.

Technology choices also shape contract value. Solar photovoltaic systems often provide low-cost daytime power, while wind can improve nighttime coverage. Battery storage adds flexibility but increases total costs.

Solar photovoltaic systems
often provide low-cost daytime power
Wind
can improve nighttime coverage
Battery storage
adds flexibility but increases total costs

IRENA reported that 81% of newly commissioned utility-scale renewable projects in 2023 cost less than fossil-fuel alternatives. Its data showed average costs near 0.044 US dollars per kilowatt-hour for solar PV and 0.033 for onshore wind. However, these figures exclude every local grid and financing condition. The cheapest asset can mislead. Prices are not promises. IEA expects renewable capacity additions to approach 5,500 gigawatts during 2024–2030, increasing competition for credible projects.

Tips:

Compare levelized cost, delivered cost, and certificate cost separately. Check hourly matching, curtailment rules, indexation, foreign-exchange exposure, and contract guarantees. Require transparent project evidence, not only annual emission claims. A ten-year contract may reduce price risk, but it can restrict future flexibility. Shorter terms may cost more. They can also protect buyers from an imperfect forecast. Use independent technical and legal reviews before signing.

Assess Suppliers, Verify Sustainability Claims, and Manage Project Risks

How to Source Renewable Energy Globally in 2026?

Global renewable sourcing is expanding quickly. The International Energy Agency expects nearly 5,500 GW of new renewable capacity by 2030. Supplier selection therefore needs more than price comparisons. Review generation assets, grid access, project permits, financing strength, and delivery history. Ask for monthly production data, not only annual forecasts. A supplier with attractive certificates may still face curtailment or weak local infrastructure.

Sustainability claims require evidence. Request chain-of-custody records, emissions calculations, land-use assessments, and independent assurance statements. Compare claims with recognized reporting methods and national registry data. The International Renewable Energy Agency reported 473 GW of renewable capacity additions in 2023. That growth is encouraging, but it also increases verification pressure. A certificate does not automatically prove additional generation. This distinction is often missed. Project risks also include extreme weather, equipment delays, currency movements, and changing grid rules. Scenario testing should cover price spikes and six-month construction delays.

Tips: Build a supplier scorecard. Weight evidence above marketing language. Visit high-risk sites when practical. Keep audit rights in contracts. Recheck claims annually. Do not treat one successful tender as permanent proof. My own view is cautious: even strong data can contain gaps, especially across emerging markets. Leave room for challenge and correction.

Global Renewable Energy Sourcing Outlook: Capacity Added in 2024

Technology mix to consider when assessing supplier capability, verifying sustainability claims, and managing project delivery risk.

Solar and wind represented the largest share of new renewable capacity in 2024, indicating strong supplier depth but also heightened exposure to manufacturing, logistics, grid-connection, and verification risks. Data: International Renewable Energy Agency, Renewable Capacity Statistics 2025.

Implement, Monitor, and Optimize a Global Renewable Energy Portfolio

A global renewable energy portfolio needs more than a collection of green contracts. It needs a practical operating system. Begin by mapping electricity demand across sites, seasons, and production hours. Then combine on-site solar, regional wind, hydropower, and carefully structured power purchase agreements. Each contract should define delivery points, volume flexibility, pricing, curtailment risks, and environmental attribute ownership.

Keep implementation local. Grid rules, permitting timelines, tax treatment, and certificate systems differ between countries. A central procurement team can set standards, while regional teams verify market conditions and operational constraints. I would also require a documented approval process. It reduces surprises. However, perfect coordination is unrealistic.

Monitoring should connect utility bills, interval meters, contract records, and weather data. Track renewable energy consumption, hourly matching, emissions factors, costs, and forecast accuracy each month. Independent assurance can test whether reported volumes match actual deliveries. Missing data should remain visible, rather than being quietly estimated. That weakness may expose poor controls.

Optimization works through regular portfolio reviews. Compare contracted supply with changing loads, grid congestion, currency movements, and technology performance. Adjust contract volumes when demand falls or facilities expand. Store surplus power where technically and legally feasible. Short-term market purchases may still be necessary during calm weather or transmission outages. They can weaken progress, but hiding that reality weakens credibility more. A strong portfolio records these exceptions and improves its assumptions over time.

How to Source Renewable Energy Globally in 2026? - Implement, Monitor, and Optimize a Global Renewable Energy Portfolio
Portfolio Dimension Global 2024 Reference Data 2026 Sourcing Application Recommended Monitoring Metric Optimization Focus
Global renewable power capacity 4,448 GW installed at year-end 2024 Use global capacity growth as the baseline for regional procurement planning and long-term supply diversification. Contracted renewable capacity as a percentage of annual electricity demand Balance near-term delivery certainty with additional long-term capacity growth.
Solar photovoltaic 1,865 GW installed
Approximately 452 GW added during 2024
Prioritize solar for fast deployment, daytime load matching, and distributed generation where grid access is available. Annual MWh delivered, capture rate, curtailment rate, and hourly load matching Combine utility-scale and on-site solar with storage or complementary nighttime resources.
Wind power 1,133 GW installed
Approximately 113 GW added during 2024
Use onshore and offshore wind to diversify production beyond solar hours and reduce weather concentration risk. Capacity factor, forecast accuracy, balancing cost, and delivered MWh Pair wind contracts with flexible demand, storage, or geographically diverse projects.
Hydropower 1,283 GW installed
Approximately 15 GW added during 2024
Use existing hydropower and qualified new projects as a source of firming, dispatchability, and seasonal flexibility. Firm capacity, reservoir availability, generation variability, and water-use constraints Value flexibility separately from energy volume and account for hydrological risk.
Bioenergy 151 GW installed
Approximately 4 GW added during 2024
Apply sustainability screening to residues, waste-based fuels, and lifecycle emissions before procurement. Lifecycle emissions, sustainable feedstock share, dispatchability, and air-quality compliance Prefer verified waste and residue streams and limit exposure to land-use change risk.
Geothermal and other renewable sources 15 GW geothermal capacity
Geothermal additions were below 1 GW in 2024
Use geothermal and other location-specific resources where dependable baseload output and suitable geology exist. Availability factor, delivered cost, resource confirmation, and project lead time Use these resources to stabilize portfolios in regions with strong resource potential.
Regional diversification Asia represented approximately 71% of global renewable capacity additions in 2024; Europe and the Americas supplied most of the remainder. Spread contracts across multiple power systems, weather zones, and regulatory markets. Regional concentration index, cross-border exposure, and percentage of load covered in each market Set regional concentration limits and avoid dependence on a single grid or policy regime.
Procurement instruments Common mechanisms include physical PPAs, virtual PPAs, utility green tariffs, on-site generation, and unbundled energy certificates. Match the instrument to the objective: physical supply for load coverage, financial contracts for price hedging, and certificates for residual claims. Additionality, contract tenor, settlement variance, certificate quality, and claim eligibility Prioritize new projects and transparent certificate tracking over volume-only procurement.
Hourly matching and storage Annual renewable matching does not demonstrate that electricity consumption is covered by renewable generation in every hour. Move from annual volume matching toward hourly or sub-hourly tracking in markets where data and contracts permit. Hourly renewable coverage, clean-energy share, storage round-trip efficiency, and imbalance volume Combine solar, wind, storage, flexible loads, and firm renewable resources to reduce shortfalls.
Grid and transmission readiness Renewable deployment is constrained by interconnection queues, transmission availability, congestion, and curtailment. Include grid-connection status, deliverability, congestion history, and upgrade responsibility in project selection. Interconnection milestone completion, congestion cost, curtailment rate, and time to commercial operation Prefer projects with secured grid studies, credible timelines, and access to uncongested demand centers.
Environmental and social safeguards Renewable projects can create land, biodiversity, water, labor, and community-impact risks if poorly planned. Require documented environmental assessments, responsible land use, labor protections, and meaningful community engagement. Grievance closure rate, biodiversity mitigation status, water intensity, and audit findings Exclude projects with unresolved material impacts and use risk-adjusted procurement scoring.
Portfolio risk and optimization The 2024 global renewable capacity increase was approximately 585 GW, with solar and wind accounting for the majority of additions. Build a balanced portfolio instead of relying on the fastest-growing technology alone. Weighted average cost, volume-weighted emissions, renewable coverage, price-at-risk, and technology concentration Rebalance annually using actual load, weather, market prices, project performance, and policy changes.
Data note: Global installed-capacity and 2024 additions figures are rounded public renewable-energy statistics for year-end 2024. Regional shares and portfolio metrics are planning references; local grid conditions, contract rules, certificate systems, and project-level verification should be checked before execution.