What Are the Top Renewable Energy Sources in 2026?
In 2026, renewable energy sources are central to how countries generate electricity and reduce dependence on fossil fuels. Solar and wind power attract attention because projects can be built at many scales, from rooftop panels to large farms. Hydropower remains an established source, while geothermal energy and sustainably managed bioenergy serve particular regions and uses. The picture is uneven. A sunny location may favor solar, while a windy coast can support strong wind output. No single source fits every grid.
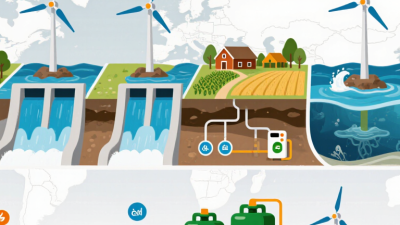
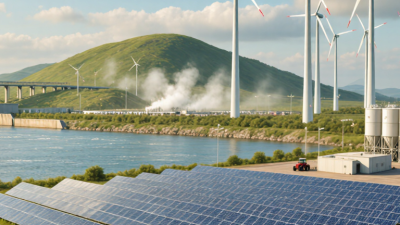
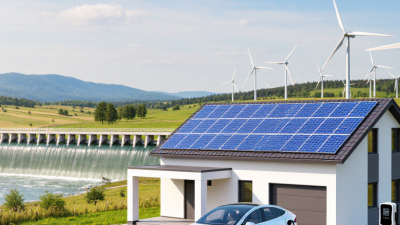
This guide compares the leading options by how they work, where they perform well, and what limits their growth. It considers practical details: panels on rooftops, turbines turning above farmland, reservoirs holding water, and heat drawn from deep underground. It also looks at reliability, costs, land and water needs, and the role of storage and transmission. These factors matter because electricity must be available when people need it, not only when weather conditions are ideal.
The exact “top” sources can shift with local resources, policy, technology, and project costs. Forecasts for 2026 should therefore be read as informed estimates, not guarantees. Headlines sometimes make the transition sound simple. It is not. Comparing evidence across regions offers a clearer view of which renewable energy sources are expanding, where they make sense, and what trade-offs deserve closer attention.
Global Renewable Baseline: 4,448 GW of Capacity Installed by 2024 (IRENA)
By the end of 2024, global renewable power capacity reached 4,448 GW, according to the International Renewable Energy Agency’s Renewable Capacity Statistics 2025. That was 585 GW more than a year earlier. A striking increase. Solar contributed about 452 GW of the new capacity, while wind added roughly 113 GW. Hydropower remained a major part of the installed base, at around 1,283 GW. These figures show why solar, wind, and hydropower dominate discussions of renewable energy in 2026.
Capacity is not the same as electricity delivered. A sunny afternoon can produce abundant solar power, but output falls after sunset; wind varies with local weather. Grid connections, storage, and demand also affect how much clean electricity reaches homes and factories. The International Energy Agency’s Renewables 2024 report projected nearly 5,500 GW of renewable capacity additions worldwide between 2024 and 2030, with solar expected to lead. That forecast is useful, but it is not a guarantee. Installed gigawatts can look impressive on paper. The less comfortable question is whether grids and storage can keep pace.
Solar Power: 1,865 GW of Global Capacity by 2024 (IRENA)
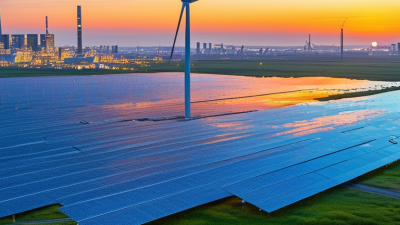
By the end of 2024, global solar power capacity had reached 1,865 gigawatts, according to IRENA. That figure measures installed capacity, not electricity produced every hour. Clouds matter. So do night-time hours. A panel’s rated output reflects favorable test conditions; actual generation shifts with sunlight, temperature, orientation, and maintenance. The scale is still striking: homes, businesses, and large solar projects have all added capacity. Still, a bigger number does not mean every panel is producing at full strength.
For 2026, the figure offers a useful baseline, not a promise of uninterrupted clean power. Solar output often peaks around midday, while demand may rise after sunset. Batteries, transmission lines, and flexible demand can help bridge that mismatch, though each brings costs and local planning challenges. A practical rooftop check is simple: look for shade from trees, dust on glass, or a clear path for wiring. Small details count. Capacity totals cannot show whether every community can afford installation or connect to the grid. That is not a minor distinction.
Wind Energy: 1,133 GW of Global Capacity by 2024 (IRENA)
Wind power enters 2026 with a substantial global base. IRENA’s Renewable Capacity Statistics 2025 reports 1,133 GW of installed wind capacity worldwide by the end of 2024. That figure describes nameplate capacity, not electricity produced every hour. Actual output varies with wind conditions, turbine availability, and grid access. The distinction matters: a gigawatt of turbines is not the same as a gigawatt of dependable supply. Still, the scale is striking. It represents machines turning across coastlines, plains, and offshore waters.
New construction remained strong. The Global Wind Energy Council’s Global Wind Report 2025 estimates that 117 GW of wind capacity was installed during 2024. Its figures use industry tracking, so totals may differ slightly from IRENA’s statistical series. More turbines do not automatically mean smoother power systems. Transmission lines, storage, and flexible demand must develop alongside projects, or clean electricity can be curtailed. Some regions also face long approval and connection queues. These bottlenecks are easy to overlook in headline capacity numbers. Wind is mature technology, but deployment is not effortless—and annual growth alone cannot show whether local communities see reliable benefits.
Top Renewable Energy Sources in 2026: Global Capacity at the End of 2024
Wind power reached 1,133 GW of installed global capacity. Solar and hydropower were also major renewable sources.
Installed capacity is measured in gigawatts (GW). Figures represent global totals at the end of 2024.
Hydropower: 1,283 GW of Global Capacity by 2024 (IRENA)
Hydropower reached 1,283 gigawatts of global installed capacity by 2024, according to IRENA. That is substantial. The figure places water among the world’s largest renewable electricity sources, but it describes capacity, not actual hourly output. A 1,000-megawatt plant cannot necessarily run at full power every day. Water levels, maintenance, and operating rules all affect generation.
The numbers become tangible at a reservoir, where water stored behind a dam can be released through turbines when demand rises. Run-of-river plants work differently, relying more closely on current stream flow. Hydropower can help balance a grid when wind or solar output changes. Yet drought may cut production for months, while dams can alter river habitats and sediment movement. These impacts do not appear in a capacity total.
For 2026 planning, 1,283 GW is a useful baseline, not a promise of steady electricity. Grid operators also need seasonal river records, reservoir levels, and local demand data. A turbine hall may hum beside a full reservoir, yet communities downstream can still face low flows. The statistic is useful, but a little too neat. In dry months, that gap can show up on the dispatch screen.
Bioenergy and Geothermal: 151 GW and 15 GW, Respectively (IRENA)
IRENA’s figures place bioenergy at 151 GW and geothermal at 15 GW. These numbers describe installed power capacity, not electricity produced over a year. That distinction matters. Bioenergy plants can use agricultural residues, forestry by-products, or organic waste, but output depends on reliable, responsibly sourced fuel. Picture a facility receiving truckloads of crop residue; moisture and transport distance can quickly affect its operation. Bioenergy can provide dispatchable power, yet burning biomass is not automatically climate-neutral. Feedstock origin, land use, and the full supply chain matter.
Geothermal’s 15 GW is much smaller, but plants can deliver steady electricity where underground heat is accessible. Wells, pipes, and turbines convert that heat into power, often with a compact surface footprint. The obstacle is geology. Exploration is costly, and suitable resources are unevenly distributed. Capacity figures alone make the comparison look simpler than it is. One source faces fuel logistics; the other, drilling risk and location limits. I would be cautious about ranking either by gigawatts alone. Reliability, emissions, water use, and local conditions deserve equal attention.
What Are the Top Renewable Energy Sources in 2026? — Bioenergy and Geothermal: 151 GW and 15 GW, Respectively (IRENA)
| Renewable energy source |
Installed capacity |
Share of the two-source total |
How it produces energy |
Common applications |
| Bioenergy |
151 GW |
About 91% |
Converts organic materials, such as biomass and biogas, into heat, electricity, or fuels. |
Electricity and heat generation; biofuels for transport. |
| Geothermal |
15 GW |
About 9% |
Uses heat from within the Earth, accessed through geothermal reservoirs and wells. |
Electricity generation and direct heating, where suitable resources are available. |
| Combined total |
166 GW |
Shares are calculated from the two capacities shown. |
Capacity figures are as stated in the supplied title and attributed there to IRENA. Shares are approximate calculations; installed capacity is not the same as electricity generated.